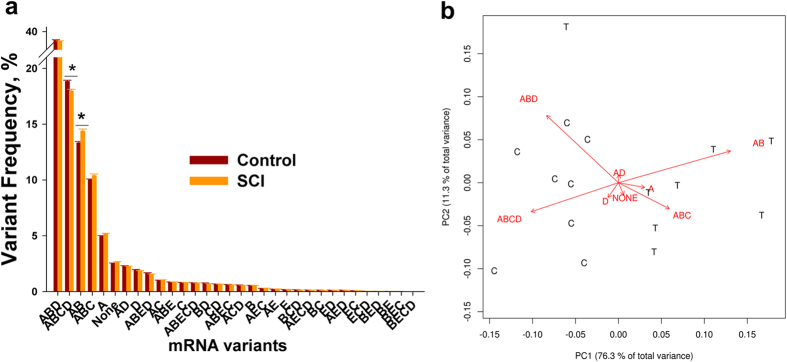
Figure 1. Analysis of 5-HT2CR editing in the spinal cord.

(a) Shown are Means ± SE of the 5-HT2CR editing variant frequencies in the spinal cord of the SCI and control rats (N = 8 rats per group) obtained by MPS. *indicates a significant difference between the groups (see Fig. 2A for details). (b) PCA of the data in (a). Shown are first two PCs of all 5-HT2CR editing variants; ABCD and AB variants are aligned along the first principal component, which by itself explains ~ 76.3% of the total data variability. T - treatment (SCI), C - control.
