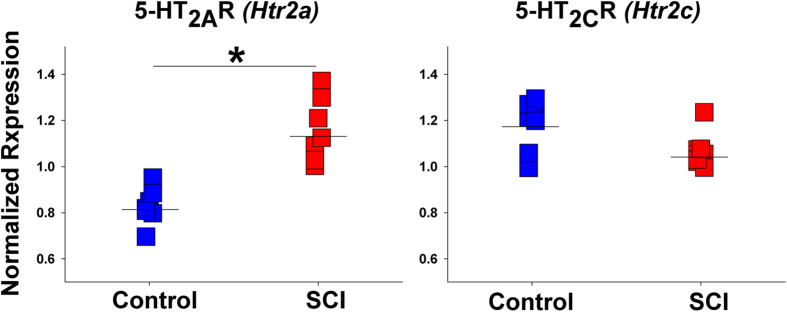
Figure 4. Expression of 5-HT2AR and 5-HT2CR following SCI.

5-HT2AR (encoded by Htr2a) mRNA expression was increased (p = 4.6e-5) and 5-HT2CR (encoded by Htr2c) mRNA expression did not differ between SCI vs. control rats. N = 8 rats per group. The measurements were performed by qPCR as in Fig. 3. *indicates a significant difference between the groups. Mean expression values in each group are shown as horizontal lines.
