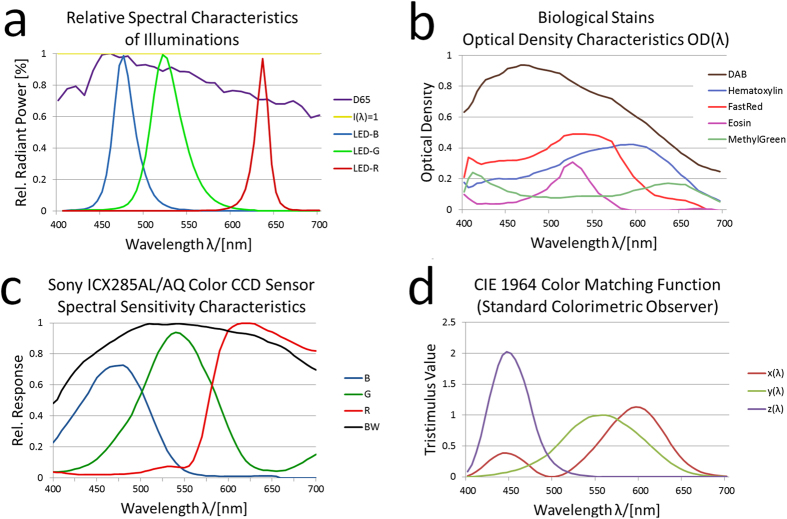
Figure 1. Spectra of illumination, stains, CCD sensors, and CIE tristimulus values.
Shown are relative spectral intensities of several illuminations (CIE D65 standard illumination, Cree RGB LED, uniform illumination spectrum Irel = 1) (a), optical density spectra of biological stains (b), spectral sensitivity characteristics of a Sony ICX285AL/AQ CCD sensor (c), and tristimulus functions of the CIE 1964 norm observer (d).

