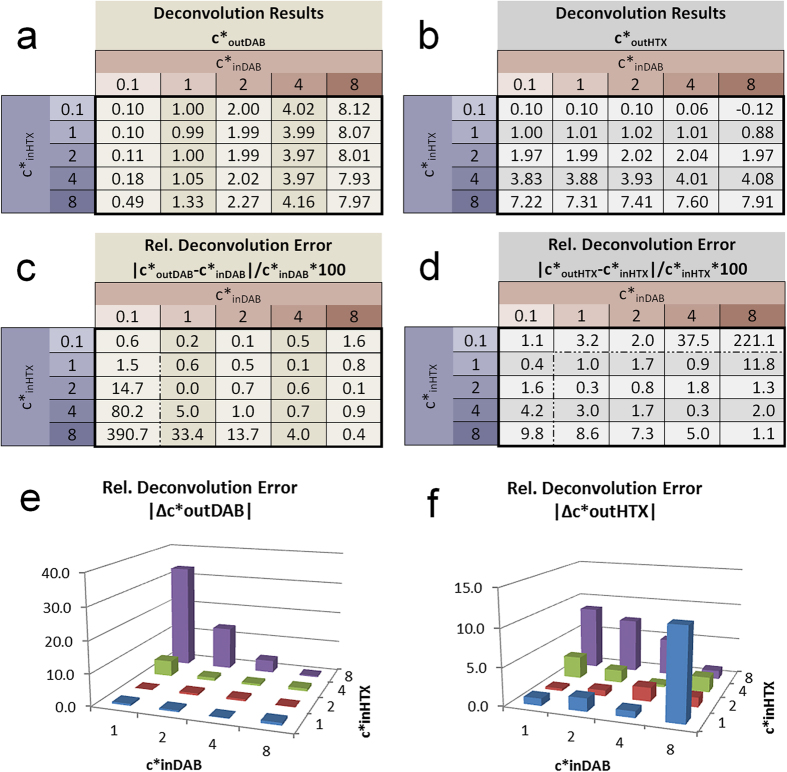
Figure 4. Deconvolution of DAB/HTX double stain modelled with RGB LED illumination and SonyICX285AL monochrome CCD sensor.
Shown are concentration results c*out for DAB (a) and HTX (b) and relative deconvolution errors for DAB (c,e) and HTX (d,f). The modelling was based on normalised stain vectors and was calculated for different input concentrations c*in. The deconvolution was performed in the B/G plane projection.

