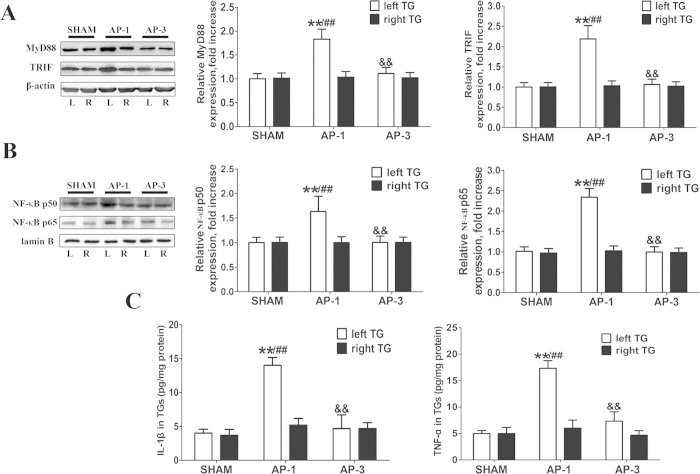
Figure 5. Expression of downstream molecules of TLR4 in the TGs.
(A) and (B) Representative immunoblots of samples from TGs of AP rat with quantitative densitometric analysis with β-actin/lamin B as an internal standard. The immunoblots were obtained from the microgel running in the same experimental conditions. There is no significant difference between the right and left TG of the SHAM group, and the pixels of the blots are normalized by the left TG of the SHAM group for comparison. The statistical analysis indicated that MyD88, TRIF and NF-κB (in the nucleus) protein levels were significantly increased in left TG of the AP-1 group, compared to the other groups. **P < 0.01 vs. left TG of SHAM; ##P < 0.01 vs. right TG of AP-1; &&P < 0.01 vs. left TG of AP-1; n = 8 for each group. (C) Results of ELISA assay for IL-1β and TNF-α in the TGs at different time points of AP rats: There was no significant difference between the right and left TG of the SHAM group, and the data were normalized by the left TG of the SHAM group. The statistical analysis indicated that IL-1β and TNF-α are significantly increased in left TG of the AP-1 group, as compared to that in the other groups. **P < 0.01 vs. left TG of SHAM; ##P < 0.01 vs. right TG of AP-1; &&P < 0.01 vs. left TG of AP-1; n = 8 for each group.

