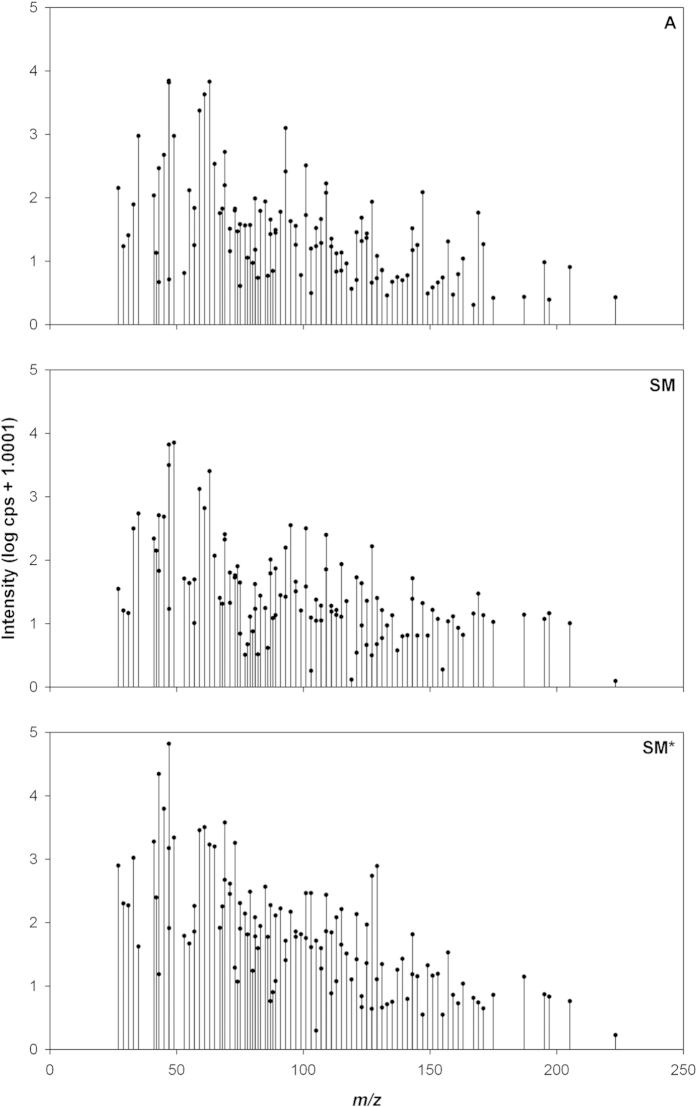
Figure 1. VOCs profile with their relative quantity in the three populations of samples coming from Tuscany (San Miniato winter - SM; San Miniato summer - SM*) and Piedmont (Alba - A).
The graph shows the total area of the identified signals (x axis: signal intensities; y axis: m/z ratio) for each population.

