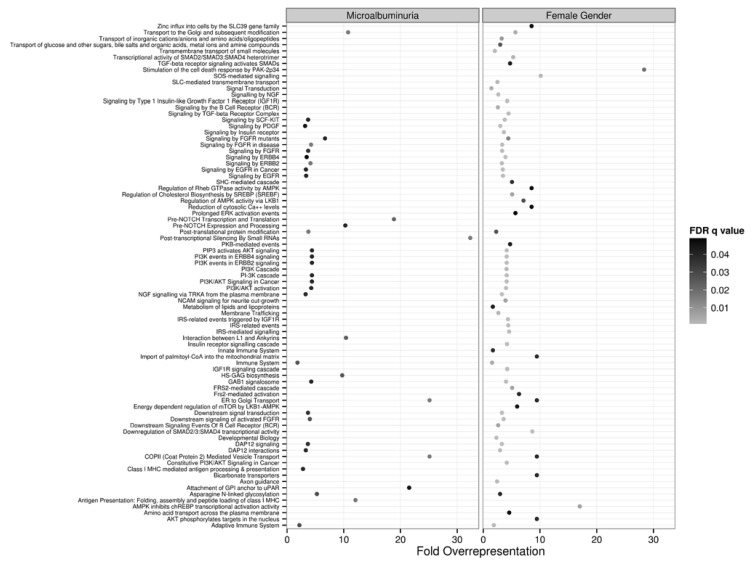
Figure 4.
Over-representation analysis in the REACTOME ontology of putative targets of microRNAs in the biclusters identified in the comparisons between microalbuminuria (MA) vs. Normal (N) groups and women vs. men plotted side by side. The fold-overrepresentation of terms in each pathway is plotted in the x-axis, while the statistical significance (False Discovery Rate-adjusted q value) is encoded in gray scale.

