Figure 2.
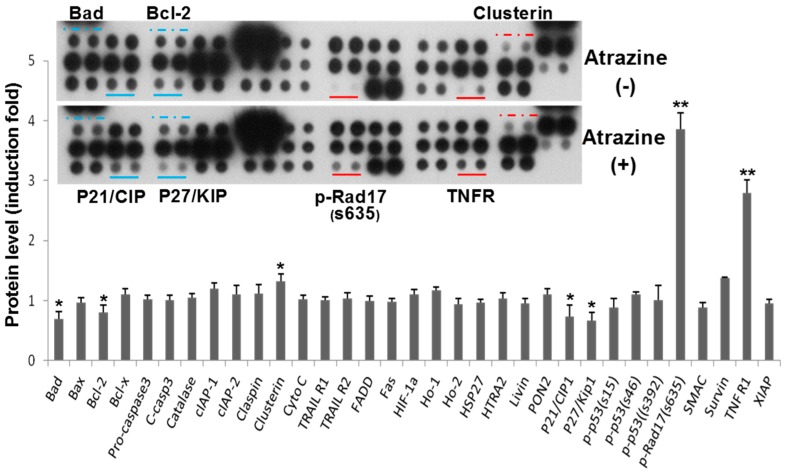
Atrazine regulates proteins related to apoptosis in MCF-10A cells. Cells (1 × 10⁶) were exposed to 0.1 μg/mL of atrazine for 6 h. Cell lysates were used for antibody array analysis, and the top figure shows the representative images of the array. The modulated protein spots in duplicate are designated under the solid lines or above the dashed lines (blue shows downregulated, red shows upregulated protein spots). Data are presented as the mean ± SD of duplicates in fold relative to controls (bottom) using the pixel density scan of the blots (n = 4, * p < 0.05, ** p < 0.01 vs. controls).

