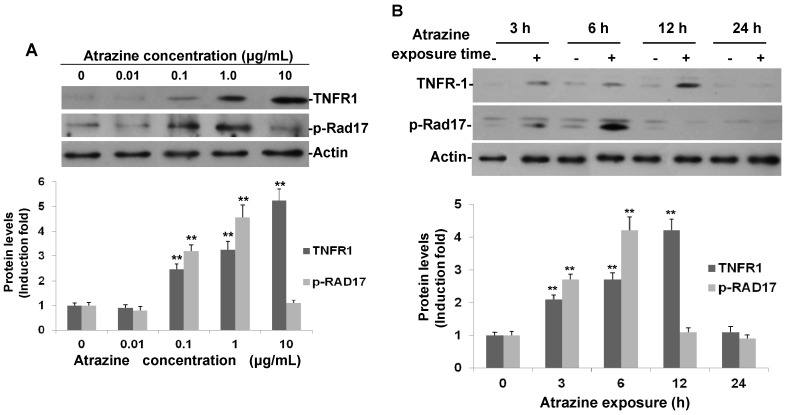
Figure 3.
Atrazine induced phospho-Rad17 (Ser635) and TNFR1expression in MCF-10A cells. (A) Dose-response of atrazine-induced p-Rad17 (Ser635) and TNFR1. MCF-10A cells (3 × 10⁵) were incubated with indicated concentrations of atrazine for 6 h and analyzed by Western blot; (B) Time course of atrazine-induced p-Rad17 (Ser635) and TNFR1 expression in MCF-10A cells. MCF-10A cells (3 × 10⁵) were treated with 0.1 μg/mL of atrazine for the indicated times and analyzed by Western blot. For each blot, the resulting fold-change of atrazine-mediated p-Rad17 and TNFR1 expression over untreated controls is provided in the corresponding histogram (n = 3) normalized to actin, ** p < 0.01 vs. controls.

