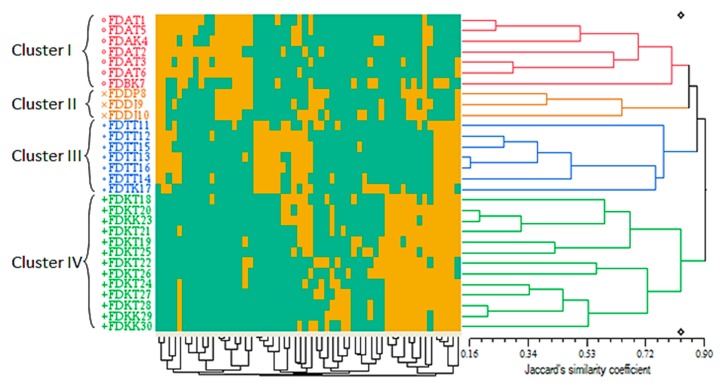
Figure 4.
Qualitative-based dendrogram of the 30 Ficus deltoidea accessions generated by the UPGMA clustering method. The green and yellow squares of the color map refer to the binary representation of the two possibilities for each qualitative characteristic in every accession (0 and 1 respectively). The genetic similarity matrices are shown by Jaccard’s similarity coefficient.

