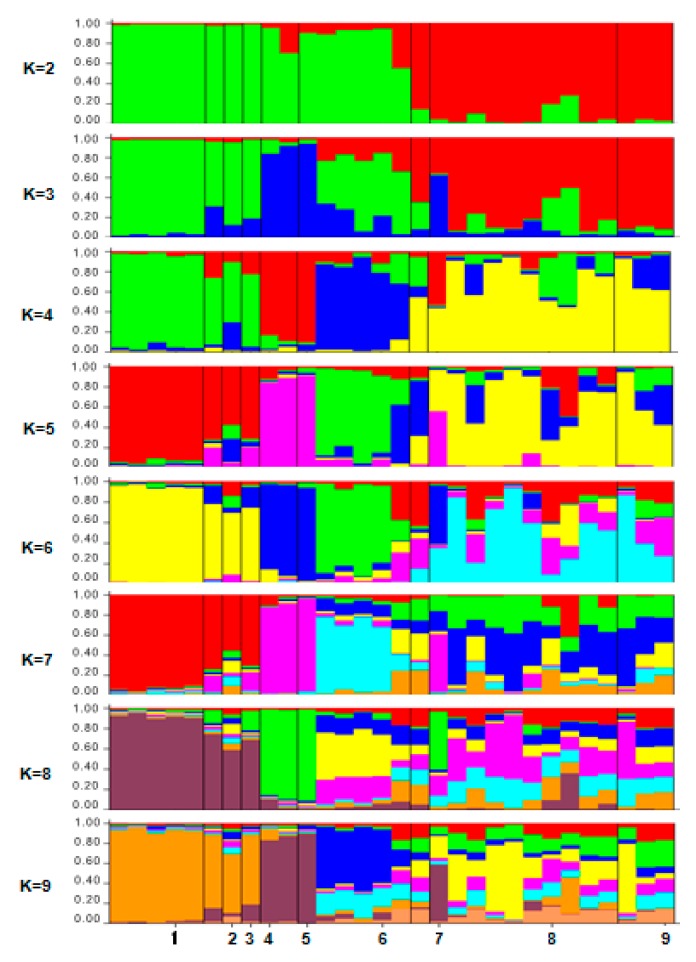
Figure 6.
The population memberships of the inspected species groups for a priori defined number of clusters K = 1–9 inferred by the STRUCTURE software (Pritchard Lab, CA, USA). Each accession is represented by a vertical column divided into K colored segments that represent the individual’s estimated membership fractions in K clusters. Black lines separate the nine populations. The numbers at the bottom of the graph refer to the population codes mentioned as in Table 1.

