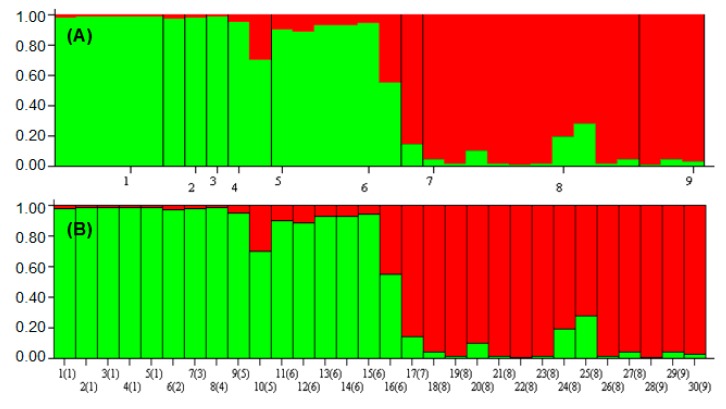
Figure 8.
Population- (A) and accession-based (B) STRUCTURE graph. Populations and accessions are labeled below each figure. The numbers on the x-axis of graph (A), as well as the numbers inside the parentheses of the x-axis of graph (B) refer to the population codes mentioned as in Table 1. The numbers besides the parentheses in the graph (B) refer to the number of accessions.

