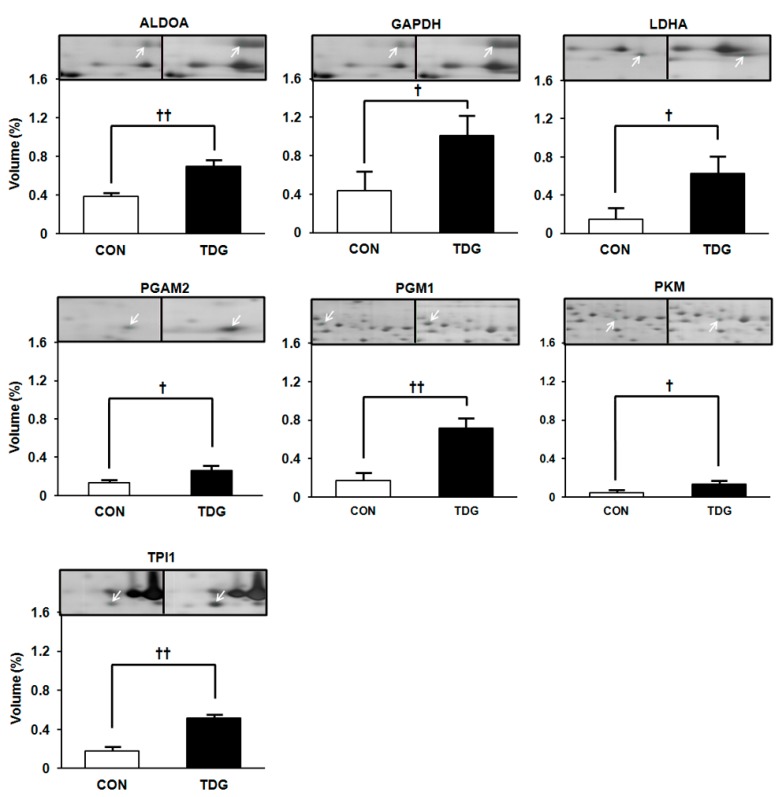
Figure 3.
WAT proteins involved in carbohydrate metabolism showing differential regulation between control (CON) and TDG-treated (TDG) groups. Band intensity was measured by ImageMaster 2-DE software version 4.95. Data are presented as the mean ± SD of volume density (%) of altered proteins in pooled samples from six rats in each group. Statistical significance between the control and TDG-treated groups was estimated by Student’s t-test, where p-values are † p < 0.05 and †† p < 0.01. Full names are presented in Table 1 and abbreviation section.

