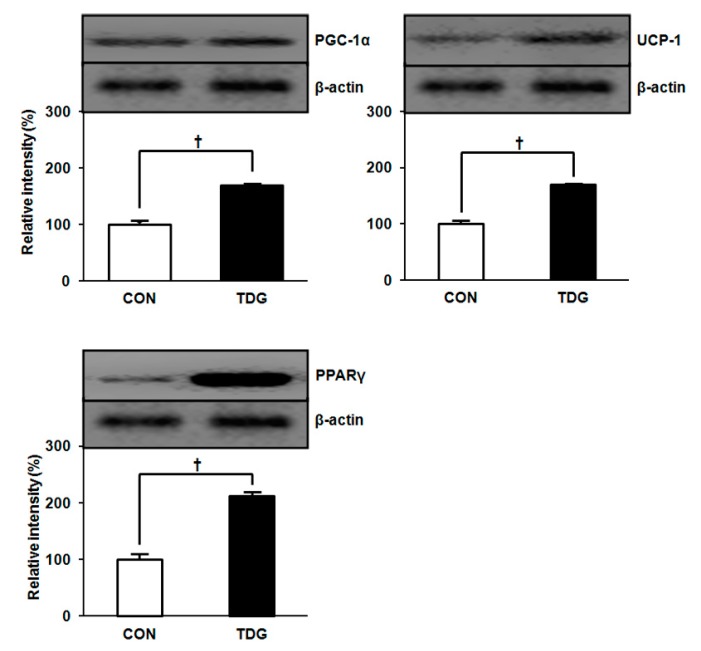
Figure 6.
Comparison of expression patterns of thermogenic marker proteins in WAT between control and TDG-treated rats. For full names of each protein, see abbreviation section. Band intensity was estemated by ImageMaster 2-DE software. Statistical significance was determined by Student’s t-test, where p values are † p < 0.05.

