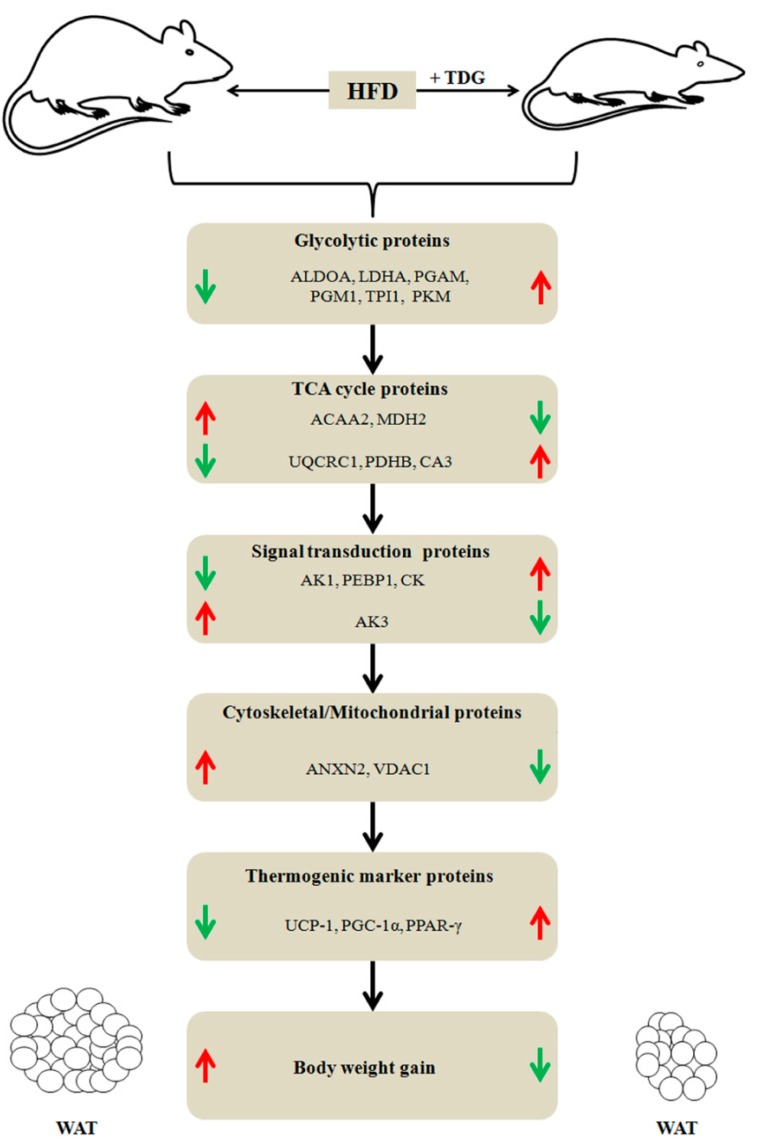
Figure 8.
Brief summary of differentially regulated proteins, and phenotypic differences between high fat diet-control and TDG-treated rats: (↑) indicates up-regulation and (↓) indicates down-regulation of proteins. For full names of proteins, refer to Table 1 and abbreviation section.

