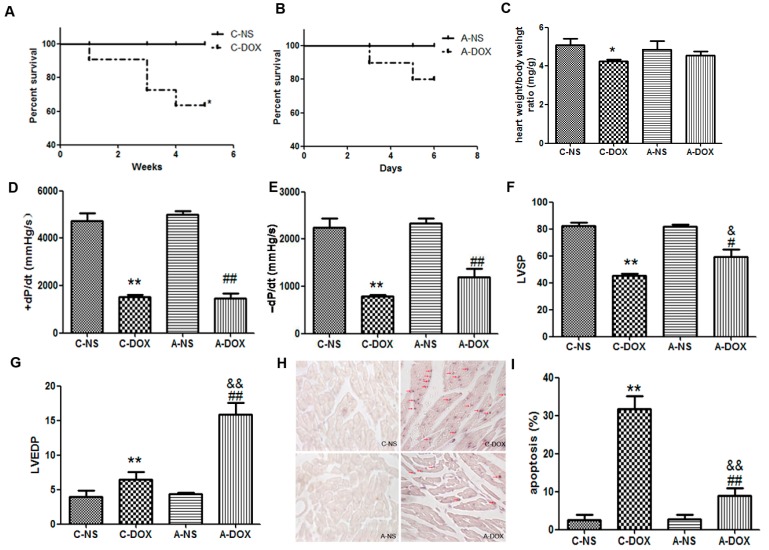
Figure 1.
The effects of DOX on the cardiac functions of mice. (A). Survival rate of mice in chronic DOX injury group (C-DOX) and chronic normal saline control group (C-NS) groups; (B) Survival rate of mice in acute DOX injury group (A-DOX) and acute normal saline control group (A-NS) groups; (C) The heart index (the ratio of heart weight to body weight); (D) +dP/dtmax, the maximum rate of left ventricular pressure rise; (E) −dP/dtmax, the maximum rate of left ventricular pressure decline; (F) LVSP, Left ventricular systolic pressure; (G) LVEDP, left ventricular end-diastolic pressure; (H) Apoptotic myocytes from mouse myocardium were detected by TUNEL staining. TUNEL-positive cells are indicated by violet blues staining in nucleus, and the TUNEL-positive cardiac myocytes are indicated by red arrows; (I) Histogram showing the quantitative analysis of TUNEL-positive cells. The values are shown as means ± SD. *, p < 0.05, compared to that in C-NS group, n = 6; **, p < 0.01, compared to that in C-NS group, n = 6; #, p < 0.05, compared to that in A-NS group, n = 6; ##, p < 0.01, compared to that in A-NS group, n = 6; &, p < 0.05, compared to that in C-DOX group, n = 6; &&, p < 0.01, compared to that in C-DOX group, n=6. Note: C-DOX: Chronic DOX injury group. C-NS: Chronic normal saline control group. A-DOX: Acute DOX injury group; and A-NS: Acute normal saline control group.

