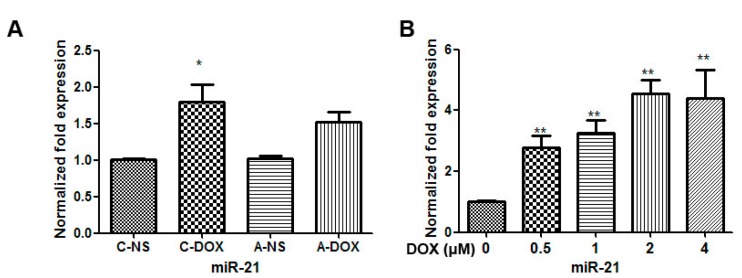
Figure 2.
The effects of DOX on the expression of miR-21 in myocardium and H9C2 cells. (A) The expression of miR-21 in myocardium. *, p < 0.05, compared to that in C-NS group, n = 3; Note: C-DOX: Chronic DOX injury group; C-NS: Chronic normal saline control group; A-DOX: Acute DOX injury group; A-NS: Acute normal saline control group; and (B) The expression of miR-21 in H9C2 cells treated with various doses (0–4 µM) of DOX for 24 h. **, p < 0.01, compared to that at 0 µM DOX, n = 3.

