Figure 5.
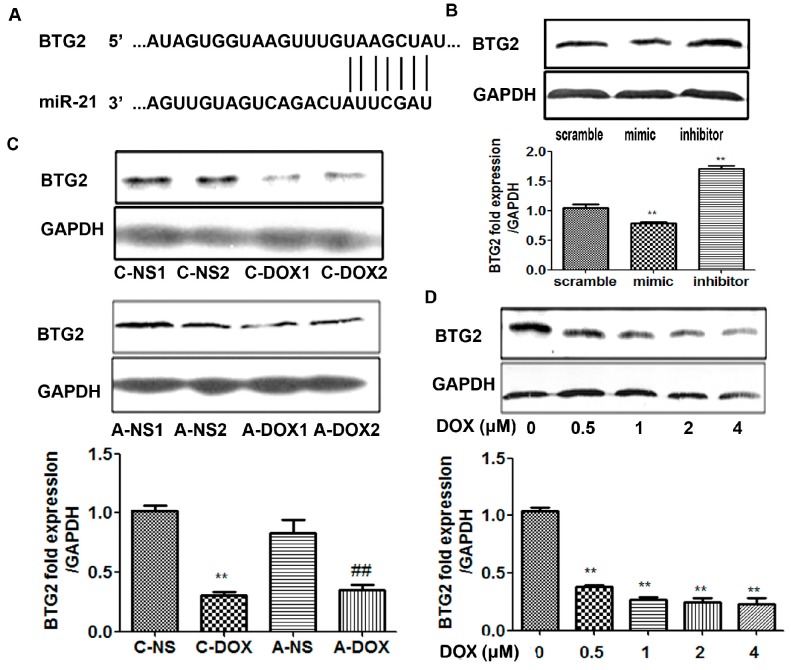
The effects of DOX on the expression of BTG-2 in myocardium and H9C2 cells. (A) Predicted consequential pairing of BTG2 (top) and miR-21 (bottom) by TargetScan; (B) The expression levels of BTG2 in H9C2 cells transfected with rno-miR-21 mimics/inhibitors/scrambled controls detected by western blotting. **, p < 0.01, compared to that of cells transfected with scramble, n = 3; (C) The expression levels of BTG2 in A-DOX and C-DOX myocardium. A-NS1, A-NS2 represented two different samples. C-DOX: Chronic DOX injury group; C-NS: Chronic normal saline control group. A-DOX: Acute DOX injury group; A-NS: Acute normal saline control group. 1, 2 behind them represent two different samples. **, p < 0.01, compared to that of C-NS group, n = 3; ##, p < 0.01, compared to that of A-NS group, n = 3; and (D) The expression levels of BTG2 in H9C2 cells treated with DOX (0–4 µm for 24 h). The panel above was the representative western blotting image and the panel below was quantitative analysis. **, p < 0.01, compared to that at 0 µM DOX, n = 3.

