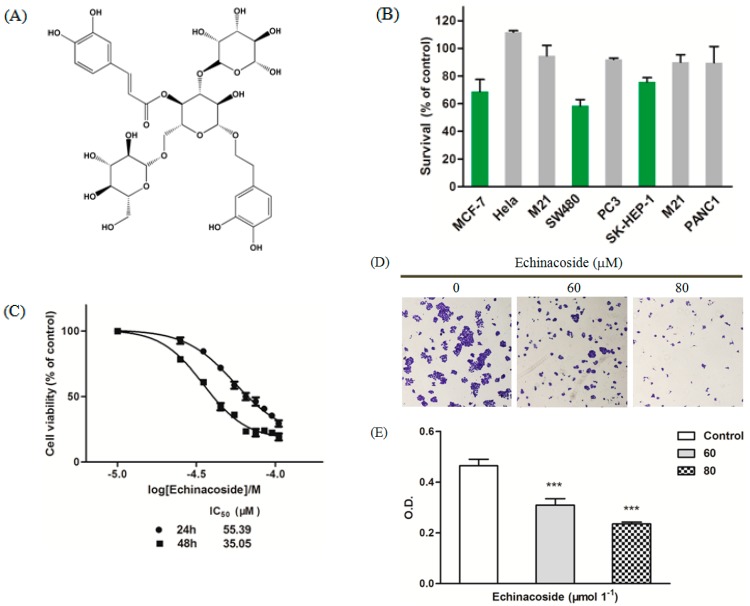
Figure 1.
(A) Chemical structure of Echinacoside; (B) MTT assay: Cells were treated with 50 μM Echinacoside for 24 and cell viability was determined by MTT assay; (C) Dose-dependent inhibition curve in SW480 cells: Cells were treated with 25, 35, 45, 55, 65, 75, 85 and 95 μM Echinacoside for 24 and 48 h and cell viability was determined by MTT assay, data were analyzed by the GraphPad Prism software; (D) Images of colony formation assay: Cells were treated with 0, 60 and 80 μM Echinacoside for 10 days and stained with crystal violet; and (E) Quantification of colony formation assay: Crystal violet-stained cells were dissolved in 70% ethanol, and absorbance at 595 nm was measured by a microplate reader (*** p < 0.001 vs. vehicle control).

