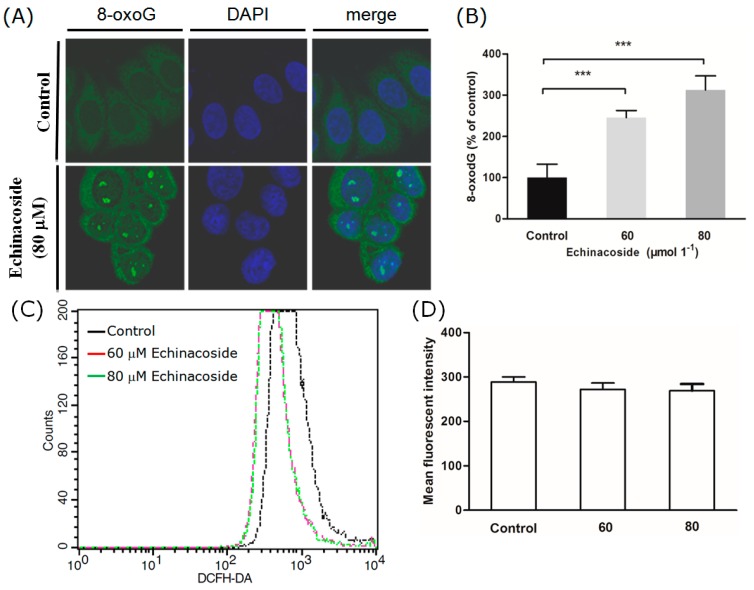
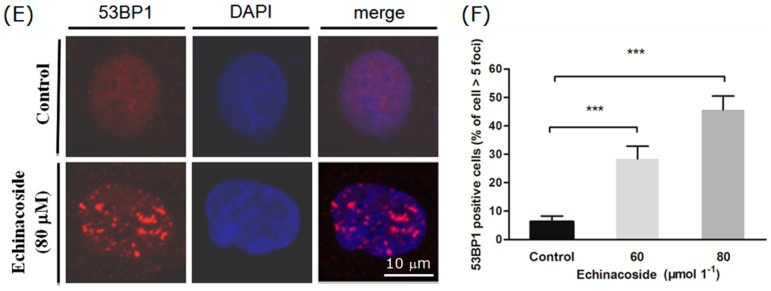
Figure 5.
Examination of cellular 8-oxoG and 53BP1. (A) Representative images of cells stained by Alexa 488-conjugated avidin and DAPI: Cells were treated with Echinacoside for 24 h; (B) Quantification of 8-oxoG content by measuring Alexa 488-fluorescent intensity (*** p < 0.001 vs. vehicle control); (C) Measurement of cellular ROS by flow cytometry: Control and Echinacoside-treated cells were loaded with the ROS probe DCFH-DA, and DCF fluorescent intensity was measured by the FACSCaliber flow cytometer; (D) Quantification of ROS from three independent experiments; (E) Representative images of cells stained by anti-53BP1 antibody; Scale bar = 10 μm; (F) Quantification of 53BP1 positive cells: Cells with > 5 53BP1 foci were counted manually, numbers shown were average of three coverslips (*** p < 0.001 vs. vehicle control).


