
Table 1.
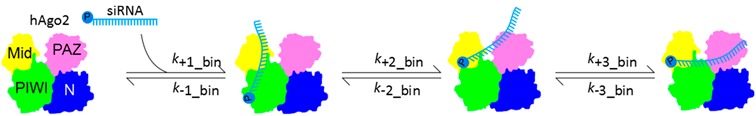
Summary of rate constants measured for formation of binary hAgo2-guide, AaAgo-guide and hAgo2-PAZ9-guide complexes. Dissociation constants calculated from association and dissociation constants are displayed. Cartoons are based on hAgo2 X-ray structures with individual domains coloured. The guide substrate is depicted in blue with the 5′-end indicated by the phosphate group. Relative positions of the guide substrate are indicated. n.d. = values not determined in this study.
| Collision Complex | 5′-End Binding | 3′-End Binding | ||||||
|---|---|---|---|---|---|---|---|---|
 | ||||||||
| Ago Protein | k1_bin (M−1·s−1) | k-1_bin (s−1) | k 2_bin (s−1) | k-2_bin (s−1) | k3_bin (s−1) | k-3_bin (s−1) | KD_bin (nM) | Reference |
| wt hAgo2 | 0.6 × 10⁸ | 6.2 | 0.26 | 0.17 | 0.012 | 0.007 | 37 | [46] |
| wt hAgo2 | 1.2 × 10⁵ | n.d. | n.d. | n.d. | n.d. | 0.007 | 57 | [47] |
| AaAgo | n.d. | n.d. | n.d. | n.d. | n.d. | 0.004 | 10 | [4,48] |
| hAgo2-PAZ9 | 0.2 × 10⁸ | 7.8 | 0.18 | 0.024 | – | – | 49.5 | [46] |