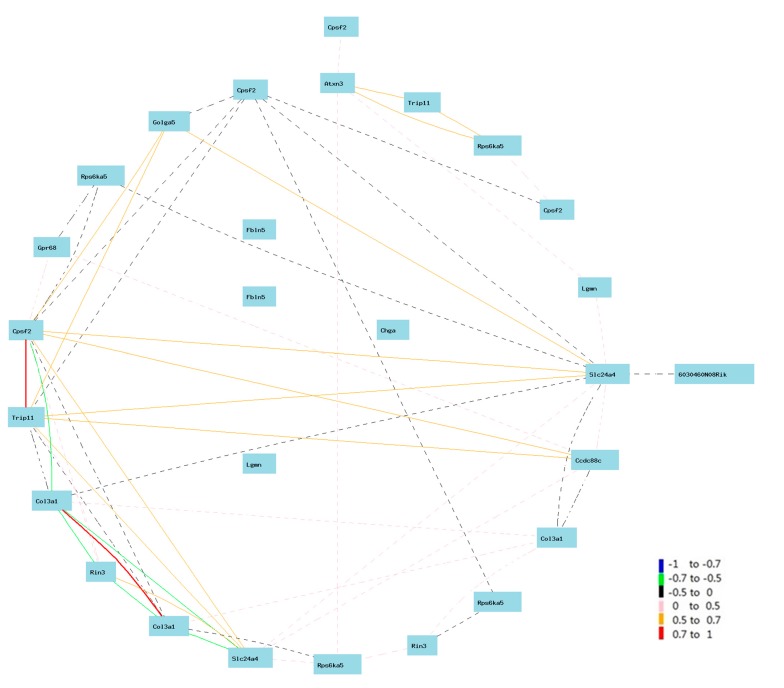
Figure 2.
Gene network between Col3a1 and candidate genes on Chr 12. The 27 nodes in the graph below show the selected traits. All nodes are displayed. The 55 edges between the nodes, filtered from the 351 total edges and drawn as curves, show Pearson correlation coefficients greater than 0.35 or less than −0.35. The graph’s canvas is 40.0 by 40.0 cm, and the node labels are drawn with a 18.0 point font, and the edge labels are drawn with a 16.0 point font.

