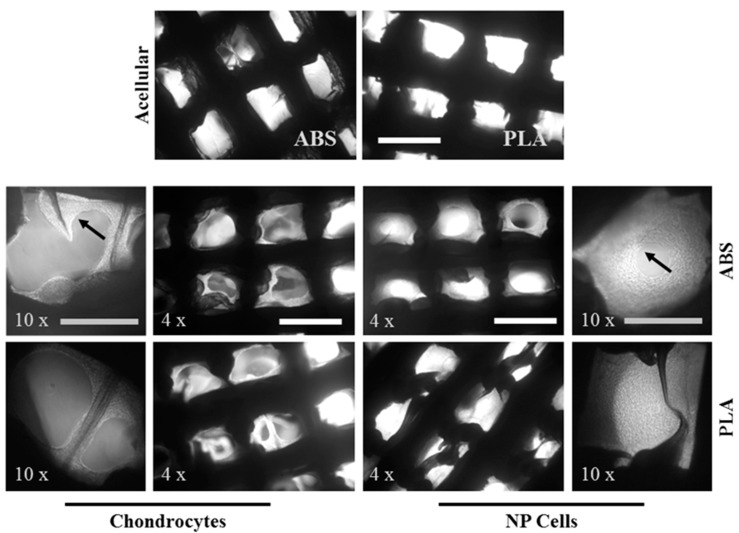
Figure 3.
Cell ingrowth on ABS and PLA scaffolds. Representative phase contrast images of cell-seeded scaffolds at 4× and 10× magnification after 21 days of culture (n = 4). Black arrows indicate cell growth and neo-tissue deposition. White scale bar represents 1 mm; grey scale bar represents 500 µm.

