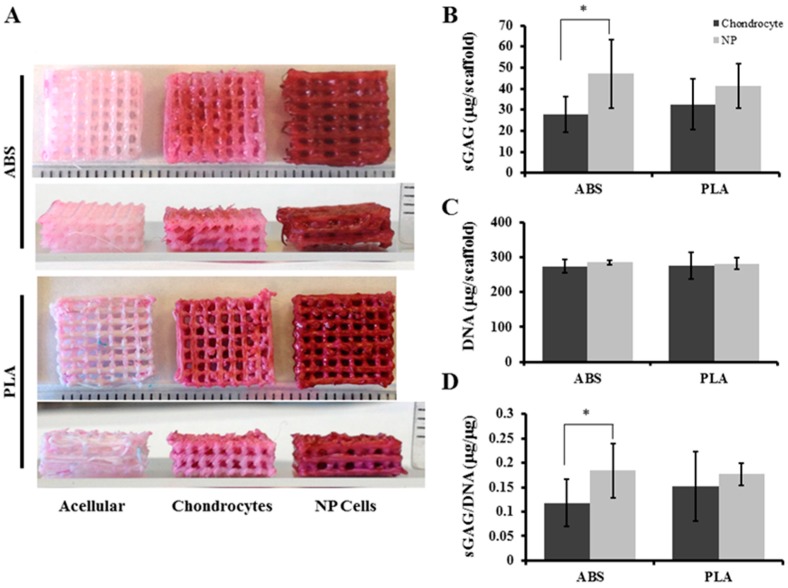
Figure 5.
Proteoglycan analysis of scaffolds. (A) Fixed acellular, chondrocyte-, and NP-seeded ABS and PLA scaffolds were stained with safranin-O/fast green after 21 days’ culture. Representative images (n = 4) showing that both chondrocyte- and NP-seeded ABS and PLA scaffolds retained intense safranin-O staining. Ruler ticks represent millimeters; (B) DMMB assay for quantifying sulfated GAG in total extract per scaffold (in 1 mL); (C) DNA content was quantified by HOECHST 33258 assay per scaffold; (D) The sGAG/DNA ratio was determined. Error bars represent ± SD. * indicates p < 0.05.

