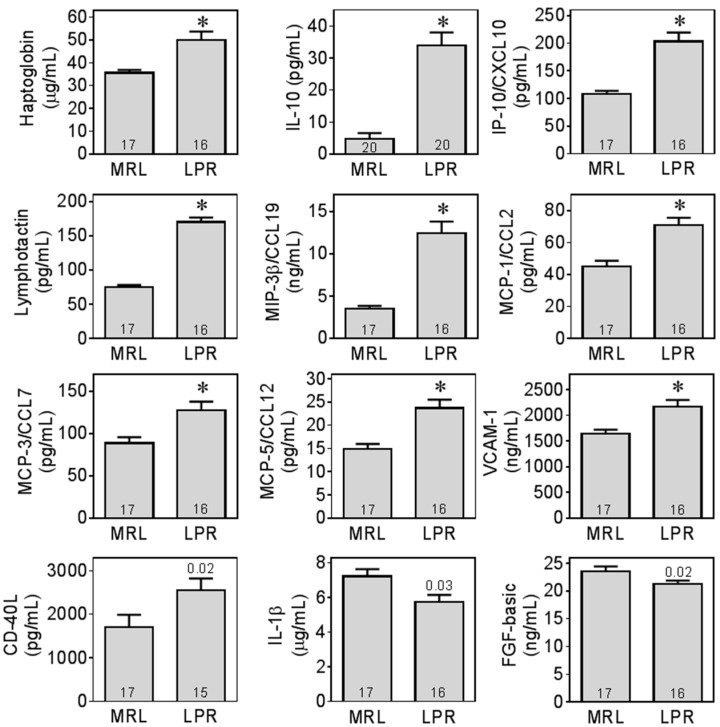
Figure 4.
MRL/lpr mice had increased levels of inflammatory biomarkers in plasma. Biomarkers within detection limit in all groups are illustrated as absolute plasma concentrations. *, significant difference (p < 0.0026) between MRL/lpr (LPR) and MRL+/+ (MRL) after Bonferonni correction for multiple comparisons. For cytokines clearly elevated in LPR mice that did not reach this criterion of statistical significance, exact p-values were shown above LPR bars. For complete list of biomarkers and detailed statistical results, please refer to Table S1.

