Figure 1.
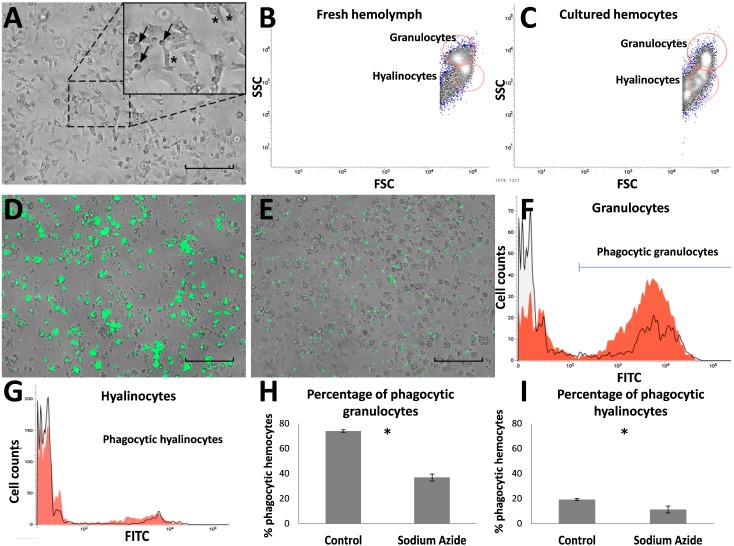
Characterization of Mytilus chilensis hemocytes in primary cell culture. (A) Light microscopy image. Insert: Granulocyte-type hemocytes (asterisks) and hyalinocyte-type hemocytes (arrows), Scale bar = 100 μm; (B,C) Flow cytometry analyses of fresh (B) and cultured (C) hemocytes showing both granulocyte-type and hyalinocyte-type hemocytes appearing in the red circles; (D) Fluorescence microscopy image of phagocytosis assay on hemocytes incubated with 0.2% FITC-labeled zymosan (green) for 1 h, Scale bar = 100 μm; (E) Inhibition of phagocytosis with 2% sodium azide, Scale bar = 100 μm; (F,G) Phagocytosis of 0.2% FITC-labeled zymosan after 1 h observed in granulocytes (F) and hyalinocytes (G). The red lines correspond to phagocytosis of control hemocytes, and the overlaid black lines correspond to phagocytosis of hemocytes incubated with sodium azide showing inhibition; (H,I) Effect of 2% sodium azide on the phagocytic activity of granulocyte-type (H) and hyalinocyte-type (I) hemocytes. Bars represent the mean ± standard errors (n = 4). * p < 0.05.

