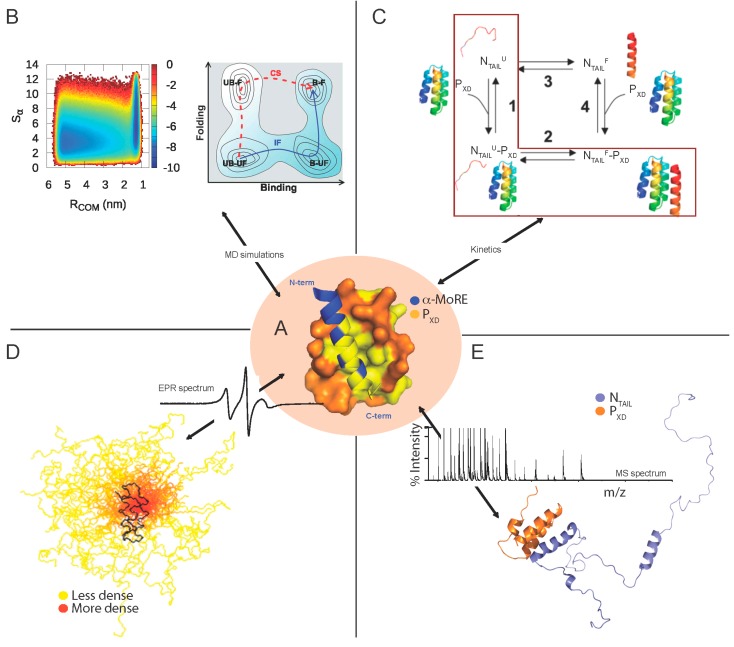
Figure 5.
Molecular mechanisms and fuzziness of the MeV NTAIL–PXD complex as unveiled by independent experimental evidences. (A) Structure of the MeV chimeric NTAIL–PXD construct (PDB code 1T6O) [36]. MeV PXD (amino acids 459–507 of P) is shown in orange with surface presentation while the α-MoRE region (amino acids 486–504 of N) is shown in blue with ribbon representation. Hydrophobic residues are shown in yellow; (B) (Left) Free-energy surface for the interaction between the α-MoRE and MeV PXD as a function of RCOM (binding order parameter) and Sα (folding order parameter); (Right) Schematic free-energy surface showing that folding upon binding takes place according to an induced folding (IF) mechanism and not to a conformational selection (CS) mechanism despite the preexistence of unbound-folded state (UB-F). Note that, in the folding upon binding process, there are four possible states: unbound-unfolded (UB-UF), bound-unfolded (B-UF), unbound-folded (UB-F), and bound-folded (B-F). The schematic picture gives a good illustration that the preexistence of the UB-F state is a necessary but not a sufficient condition for a conformational selection mechanism. (Adapted with permission from [84]). Copyright 2013 National Academy of Sciences; (C) A kinetic-based model showing the folding after binding mechanism of the MeV NTAIL–PXD interaction (highlighted in a red square). Indeed, NTAIL recognizes PXD by first forming a weak encounter complex in a disordered conformation and is then subsequently locked-in by a folding step. (Reprinted with permission from [128]); Copyright 2014 American Chemical Society (D) Model of the partly disordered MeV NTAIL–PXD complex as a conformational ensemble as derived from a combined EPR and modeling approach. 50 best-fit structures of the 488–525 region of NTAIL in complex with PXD. The NTAIL conformers are depicted with a color gradient ranging from yellow to red with increasing structural density, while PXD is shown in black (modified from [129]). A typical EPR spectrum is also shown; and (E) Cartoon representation of the structural model of the NTAIL–PXD complex as derived from a combined ESI-IM-MS and modeling approach. The disordered NTAIL is shown in blue and the ordered X domain of P is shown in orange. A typical MS spectrum is shown. Reprinted with permission from [122]. Copyright 2014 The American Society for Mass Spectrometry. EPR: electron paramagnetic resonance, MS: mass spectrometry, MoRE: Molecular Recognition Element, MD: molecular dynamics. Structures were drawn using Pymol [124].

