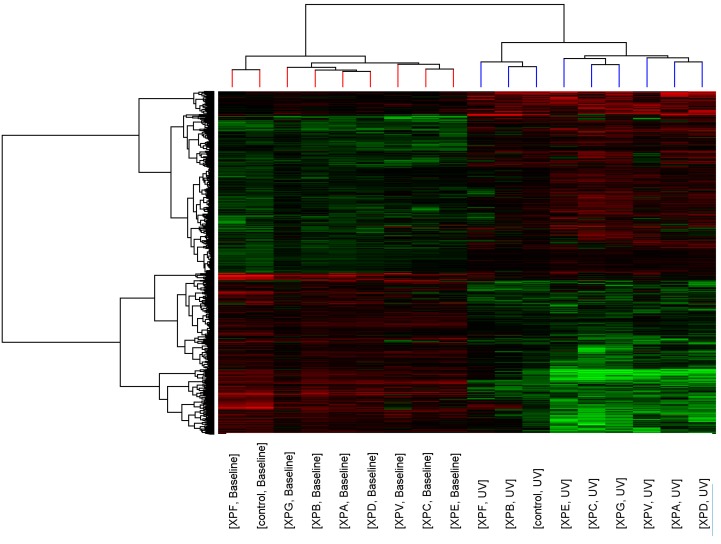
Figure 1.
Cluster analysis of control and XP complementation groups before and after UVC-light. Each column represents average transcript expression for duplicate cell lines for control and each of the XP complementation groups before and after 2 J/m2 UVC-light exposure. Down-regulation is represented as green, up-regulation as red and normal expression as black. The dendrogram represents the relationship between and within the controls and XP complementation groups.

