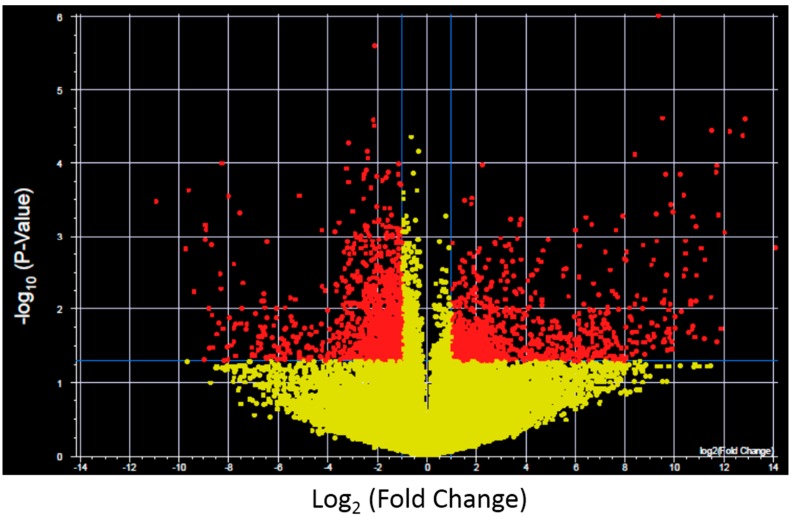
Figure 2.
Example of a Volcano plot of altered transcript expression in control fibroblasts after UVC irradiation. −log10 (p-value) plotted against log2 (Fold Change) for transcript expression in control fibroblasts before and after 2 J/m2 UVC irradiation. Red spots represent 2575 transcripts with p < 0.05 and fold change >2, yellow spots represent transcipts that were not differentially expressed. Volcano plots were generated for each XP complementation group.

