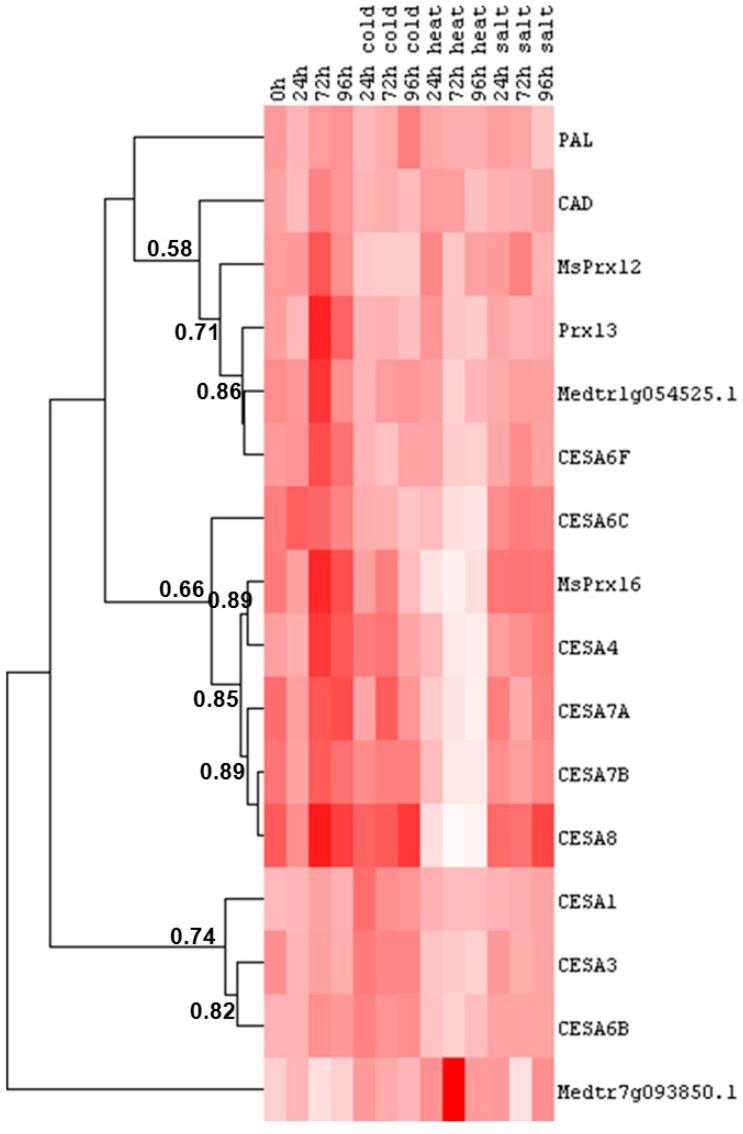
Figure 5.
Heat map representation of the data reported in Table S5 and Table S6 showing the hierarchical clustering of cell wall-related genes in response to abiotic stresses at different time points in alfalfa roots. The numbers indicate the Pearson gene correlation coefficient. Pixel colour intensity is proportional to the actual expression values.

