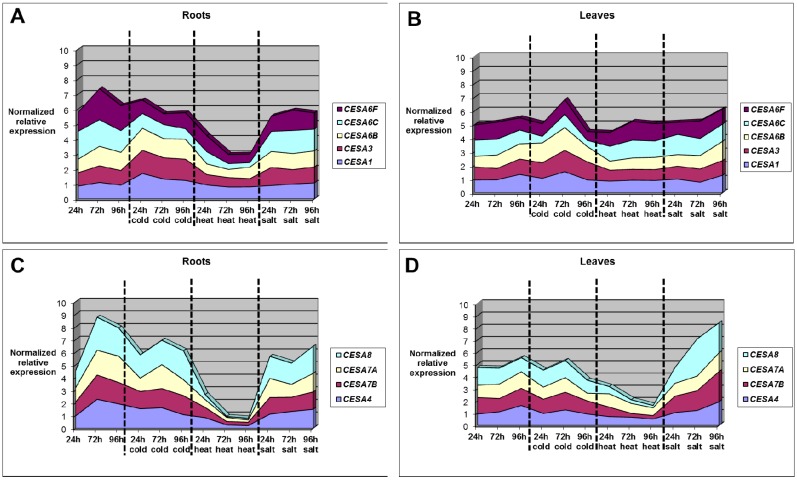
Figure 8.
Graphs showing the change in expression of primary and secondary CesAs in roots (A,C) and leaves (B,D) of alfalfa plants subjected to different abiotic stresses. The data correspond to the values reported in Supplementary Tables S5 and S7. The control condition and the different stress treatments are boxed. The standard error of the mean is not represented in the graphs.

