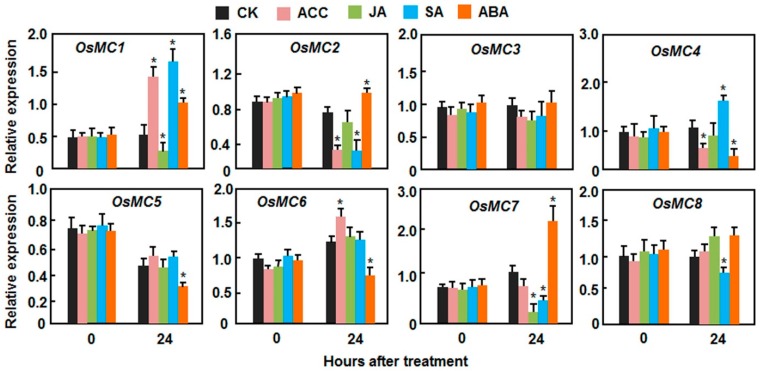
Figure 6.
Expression patterns of OsMCs in response to stress-related hormones. Two-week-old seedlings were sprayed with 100 µM SA, 100 µM MeJA, 100 µM ACC, 100 µM ABA or similar volumes of solution as controls. Leaf samples were collected at indicated time points and relative expression of the genes is shown as folds of transcript level of the actin gene. Data presented are the means ± SD from thee independent experiments and * above the columns indicate significant difference at p < 0.05 level.

