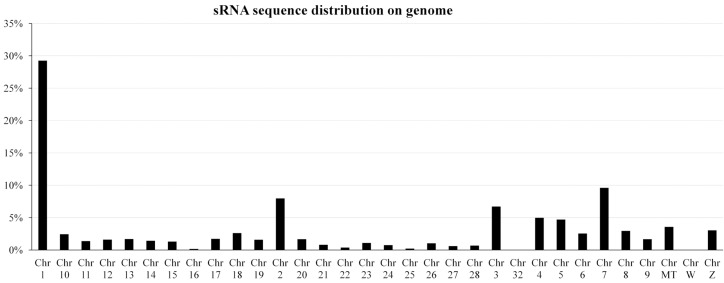
Figure 2.
Distribution percentages of unique small RNAs sequences on chicken chromosome. The unique small RNA reads were mapped to chromosome by BLASTing with the chicken genome; and then the percentages of mapped reads of each chromosome in total mapped reads were then calculated. Chr MT: mitochondrial genome.

