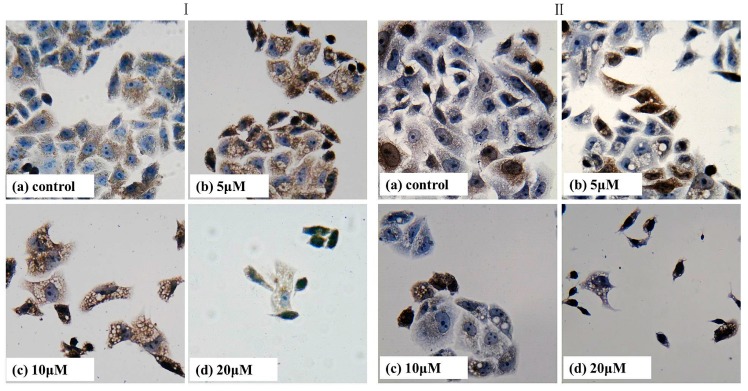
Figure 7.
Immunohistochemical analysis of NF-κB/p65 (I) and COX-2 (II) in control and T-OA treated groups of Bel-7402 cells. (Ia) Control group without T-OA; (Ib) Treated with 5 µM T-OA; (Ic) Treated with 10 µM T-OA; (Id) Treated with 20 µM T-OA; (IIa) Control group without T-OA; (IIb) Treated with 5 µM T-OA; (IIc) Treated with 10 µM T-OA; and (IId) Treated with 20 µM T-OA. (×400).

