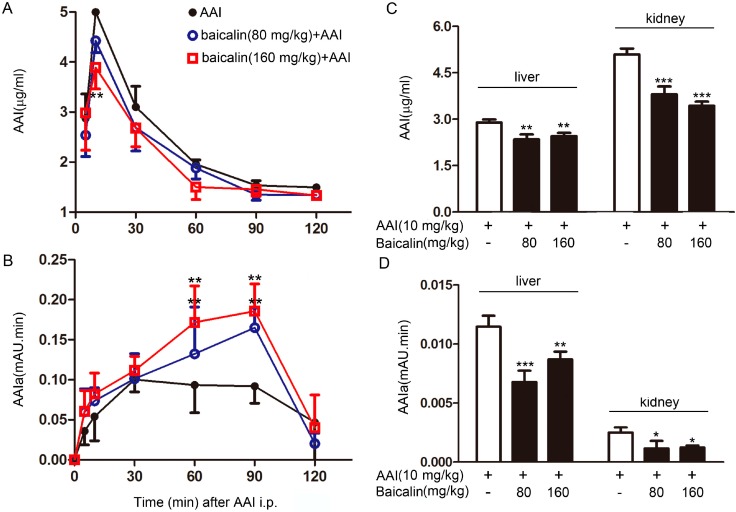
Figure 3.
Levels of AAI and its major metabolite AAIa in the plasma, liver, and kidney. Blood samples were collected from mice at the indicated time points after AAI injection. Plasma levels of AAI (A) and AAIa (B) were measured by high-performance liquid chromatography (HPLC); Tissue samples from mice were collected at 30 min after AAI injection to determine the levels of AAI (C) and AAIa (D). Data are expressed as the mean ± SD (n = 5). * p < 0.05, ** p < 0.01, *** p < 0.001 versus the AAI group.

