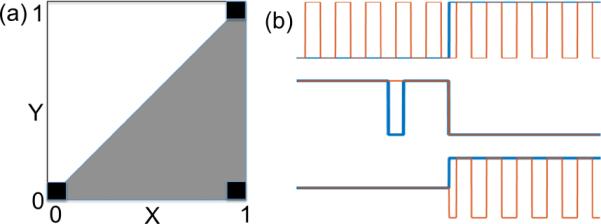
Fig. 2.

(a) Asymmetry in the joint distribution of two random variables X and Y in the binary-valued case (denoted by black squares) and the continuous-valued case (denoted by the shaded triangle); (b) Hypothetical cases illustrating different cases of correlation and necessity between X (blue) and Y (orange).
