
Fig. 5.
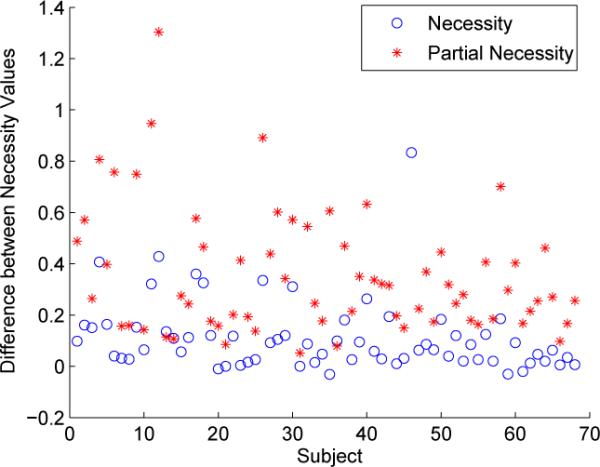
Plot of the differences between the two necessity values (i.e. necessity of PCGD to IP-AG minus necessity of IP-AG to PCG-D) across the study population. Corresponding results for partial necessity are also shown.
Official websites use .gov
A
.gov website belongs to an official
government organization in the United States.
Secure .gov websites use HTTPS
A lock (
) or https:// means you've safely
connected to the .gov website. Share sensitive
information only on official, secure websites.
Plot of the differences between the two necessity values (i.e. necessity of PCGD to IP-AG minus necessity of IP-AG to PCG-D) across the study population. Corresponding results for partial necessity are also shown.