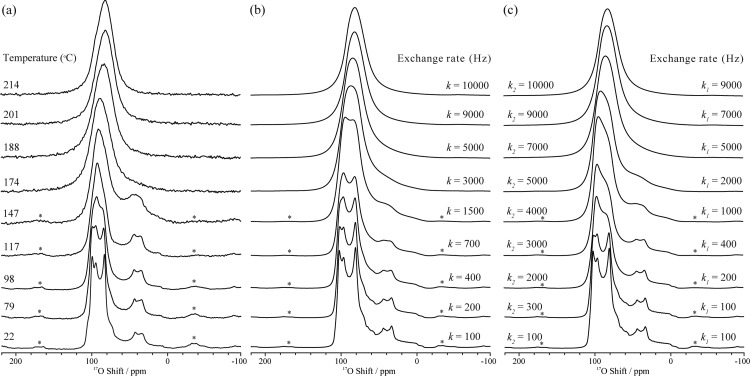
Figure 3.
(a) Experimental variable-temperature 17O NMR spectra acquired with a MAS frequency of 12.5 kHz and (b) simulated 17O line shapes assuming rotations about all four C3 axes (i.e., four 3-fold rotations) with a single site exchange rate k, and (c) simulated 17O line shapes assuming a second model with exchange rates k1 and k2 as depicted in Figure 4. Asterisks denote spinning side bands. Note that a value for k, k1, and k2 of 100 Hz corresponds to motion in the slow exchange limit. 100 Hz simply represents the upper limit for the rates at this temperature.

