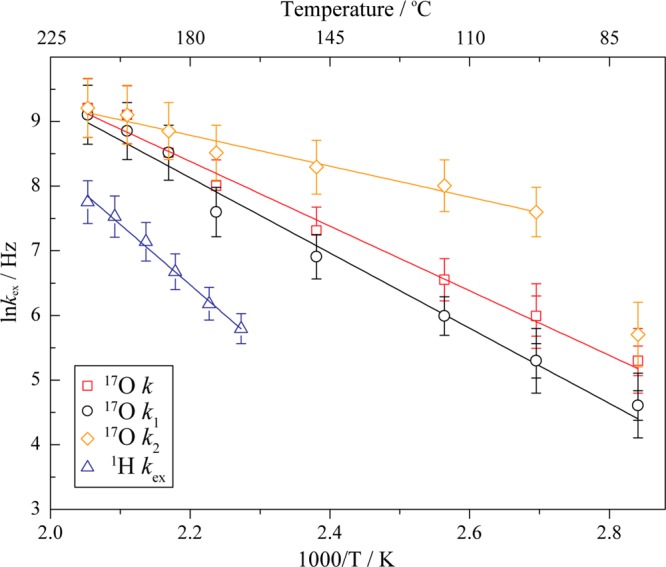
Figure 5.

Arrhenius plots for the oxygen four-site exchange process, assuming first, rotations about the four P–O C3 axes (with identical exchange rates k, red open squares), and second, a faster C3 rotation about the P–O1 axis (k2, orange open diamonds), and slower C3 rotations about the P–O2, P–O3d, and P–O3a axes (k1, black open circles) of the phosphate ion. The red, black, and orange solid lines indicate the Arrhenius equation least-squares fits to the rates k, k1, and k2, giving Ea = 0.43 ± 0.05, 0.50 ± 0.07, and 0.21 ± 0.06 eV, respectively, in the temperature range 79–214 °C (for k2, 98–214 °C). Error bars indicate errors of 5% except 20% for data points at lower temperatures (79 and 98 °C). The blue solid line corresponds to the 1H two-site exchange data obtained in our earlier study20 (rate kex, blue open triangles) with Ea = 0.70 ± 0.07 eV (167–214 °C) which is shown here for comparison.
