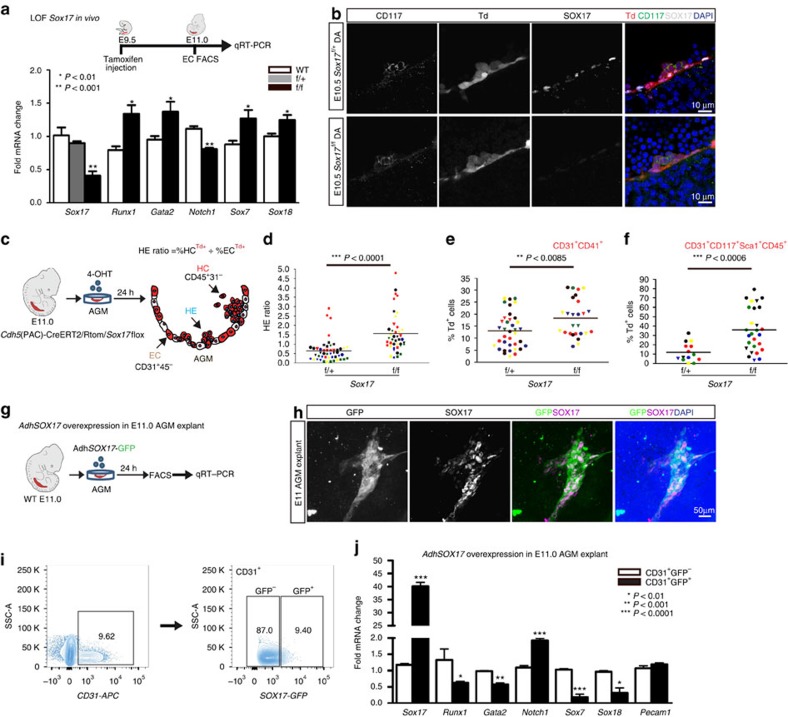
Figure 2. Endothelial to haematopoietic conversion is increased after Sox17 loss.
(a) Schema and bar graph of qRT–PCR analyses of sorted endothelial cells from E11 embryos after in vivo Sox17 ablation at E9.5. Error bars indicate standard error of the mean (n=3 litters, embryos pooled by genotype). LOF, loss of function. (b) Immunofluorescence of Sox17 heterozygous and homozygous embryos at E10.5 after in vivo Cre induction (tamoxifen induction at E9.5). Haematopoietic clusters are labelled by CD117 (green), Cre traced endothelial and cluster cells in red (Td+). SOX17 (grey) is absent in homozygous mutant endothelium. DAPI in blue. DA, dorsal aorta. Scale bar, 10 μm. Single channels in black and white. (c) Schematic of AGM explant analysis depicts in vitro Cre lineage tracing and calculation of hemogenic output (HE ratio); the ratio between per cent labelled (Td+) haematopoietic cells (CD45+CD31−) to per cent labelled (Td+) endothelial cells (CD31+CD45−). 4OHT, 4-hydroxytamoxifen. (d–f) Each data point represents a separate embryo/AGM explant, littermates are depicted by the same data point colour and shape. Bar indicates group mean. P values calculated on Student's t-test between groups, significance also validated by two-way analysis of variance, (Supplementary Table 2). (d) The HE ratio of Sox17 homozygous (f/f) and heterozygous (f/+) mutant explants. f/+ n=45, f/f n=38, 15 litters. (e) Percentage of traced Td+ hemogenic endothelial cluster cells, designated as CD31+CD41+. f/+ n=37, f/f n=26, 9 litters. (f) Percentage of traced (Td+) maturing HSPCs (identified as CD31+CD117+Sca1+CD45+), f/+ n=14, f/f n=27, 7 litters. (g) Schema depicts overexpression analyses in wild-type AGM explants at E11.0. (h) Immunofluorescence of E11 AGM explant after human adenoviral SOX17-GFP infection. GFP in green, SOX17 in magenta and DAPI in blue. Scale bar as indicated. (i) Cell sorting strategy for endothelial cells (CD31+) after exposure to AdhSOX17-GFP (GFP), where GFP+ and GFP− populations were gated. (j) Bar graph of qRT–PCR analyses of sorted E11 AGM CD31+ cells after AdhSOX17-GFP infection. Error bars indicate s.e.m. CD31+GFP− population served as a control, set to one for comparisons of fold change, n=3 litters, embryos pooled, P values as indicated. (a,j) P values reflect Student's t-test.

