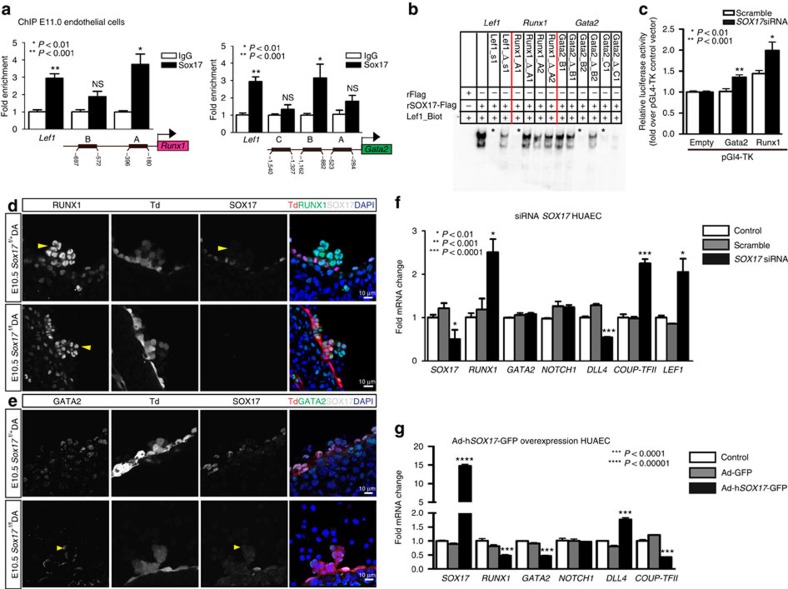
Figure 3. SOX17 directly binds Runx1 and Gata2 for repression of haematopoietic fate.
(a) SOX17 chromatin immunoprecipitation (ChIP) qRT–PCR of E11.0 sorted endothelial cells. Letters denote regions with SOX17-binding site consensus sequences upstream of Runx1 and Gata2 promoters, and Lef1 as a positive control. Error bars indicate s.e.m. IgG control set to one for comparisons of fold change, n=3 litters, embryos pooled, P values as indicated. (b) Electrophoretic mobility shift assay (EMSA) of putative SOX17-binding sites within ChIP sequences designated by letters in a. Each lane represents biotin-labelled duplexed oligonucleotides containing the Lef1 promoter SOX17-binding site (Lef1_Biot). Addition of rSOX17-Flag produces a specific shift, indicating protein–DNA complex (lane 2), which is competed away by unlabelled Lef1 (Lef1_s1), while mutant probe does not compete (Lef1_Δ_s1). Similar designations are used for putative binding sites (and mutants) in Runx1 and Gata2 sequences. Asterisks denote competitive binding. (c) Bar graph depicts luciferase activity of Gata2 and Runx1 promoters after Sox17 siRNA versus control (scramble). P values as indicated. Error bars represent s.e.m. (d) Immunofluorescence of haematopoietic cell clusters (arrowhead) in E10.5 dorsal aorta (DA) of Sox17f/f and Sox17f/+ mutants (after tamoxifen mediated Cre induction at E9.5). Traced cells labelled in red (Td+), SOX17 in grey and RUNX1 in green. DAPI in blue. Scale bar, 10 μm. Single channels in black and white. (e) GATA2 (green) and SOX17 (grey) immunofluorescence of haematopoietic cell clusters in E10.5 DA of Sox17f/+ and Sox17f/f (arrowhead) mutants (Cre induction at E9.5). Traced cells in red (Td+), SOX17 in grey and RUNX1 in green. DAPI in blue. Scale bar, 10 μm. Single channels in black and white. (f) SOX17 siRNA knockdown in HUAECs and qRT–PCR analysis. Control represents treatment with lipofectin alone, SOX17 siRNA compared with scrambled (n=3 experiments, error bars indicate s.e.m.). P values as indicated. (g) Adenoviral-mediated overexpression of hSOX17 in HUAECs and qRT–PCR analyses, P values calculated with respect to Adeno-GFP-infected cells, control represents uninfected cells (n=3 experiments, error bars indicate s.e.m.).

