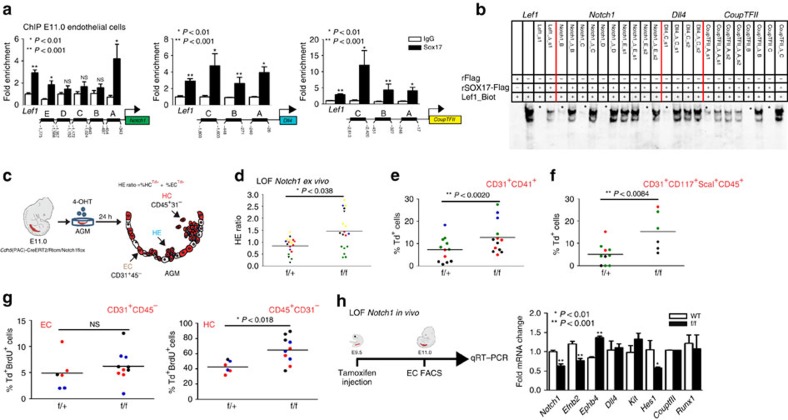
Figure 4. The role of the Notch pathway in endothelial to haematopoietic fate decisions.
(a) SOX17 (ChIP) qRT–PCR of E11.0 sorted endothelial cells. Letters denote regions upstream of Notch1, Dll4, and Coup-TFII promoters, and Lef1 as a positive control. Error bars indicate s.e.m.. IgG control set to one for comparisons of fold change, n=3 litters, embryos pooled, P values as indicated. (b) EMSA of putative SOX17-binding sites within ChIP sequences (designated by letters in a). Each lane represents biotin-labelled duplexed oligonucleotides spanning the Lef1 promoter SOX17-binding site (Lef1_Biot). Addition of rSOX17-Flag produces a specific shift, indicating protein–DNA complex (lane 2), which is competed away by unlabelled Lef1 (Lef1_s1), while mutant probe does not compete (Lef1_Δ_s1). Similar designations are used for putative binding sites (and mutants) in Notch1, Dll4 and Coup-TFII sequences. Asterisks denote competition. (c) Schematic of AGM explant analysis depicts in vitro Cre lineage tracing and calculation of hemogenic output (HE ratio); the ratio between per cent labelled (Td+) haematopoietic cells (CD45+CD31−) to per cent labelled (Td+) endothelial cells (CD31+CD45−). (d–g) Each data point represents a separate embryo/AGM explant, littermates are depicted by the same data point colour and shape. Bar indicates group mean. P values calculated on Student's t-test between groups, significance also validated by two-way analysis of variance (Supplementary Table 5) (d) The HE ratio of Notch1 homozygous (f/f) and heterozygous (f/+) mutant explants. f/+ n=18, f/f n=21, 6 litters. (e) Percentage of traced Td+ hemogenic endothelial cluster cells, designated as CD31+CD41+. f/+ n=12, f/f n=13, 4 litters. (f) Percentage of traced (Td+) maturing HSPCs (identified as CD31+CD117+Sca1+CD45+) f/+ n=10, f/f n=6, 3 litters. (g) BrdU+ cells measured after 2-h incubation with BrdU in traced ECs (left) and traced HCs (right) demonstrates a significant increase in HC proliferation, f/+ n=6, f/f n=10, 3 litters. (h) Schema and bar graph of qRT–PCR analyses of sorted endothelial cells from E11 embryos after in vivo Notch1 ablation at E9.5. Error bars indicate s.e.m. (n=3 litters, embryos pooled by genotype). LOF, loss of function.

