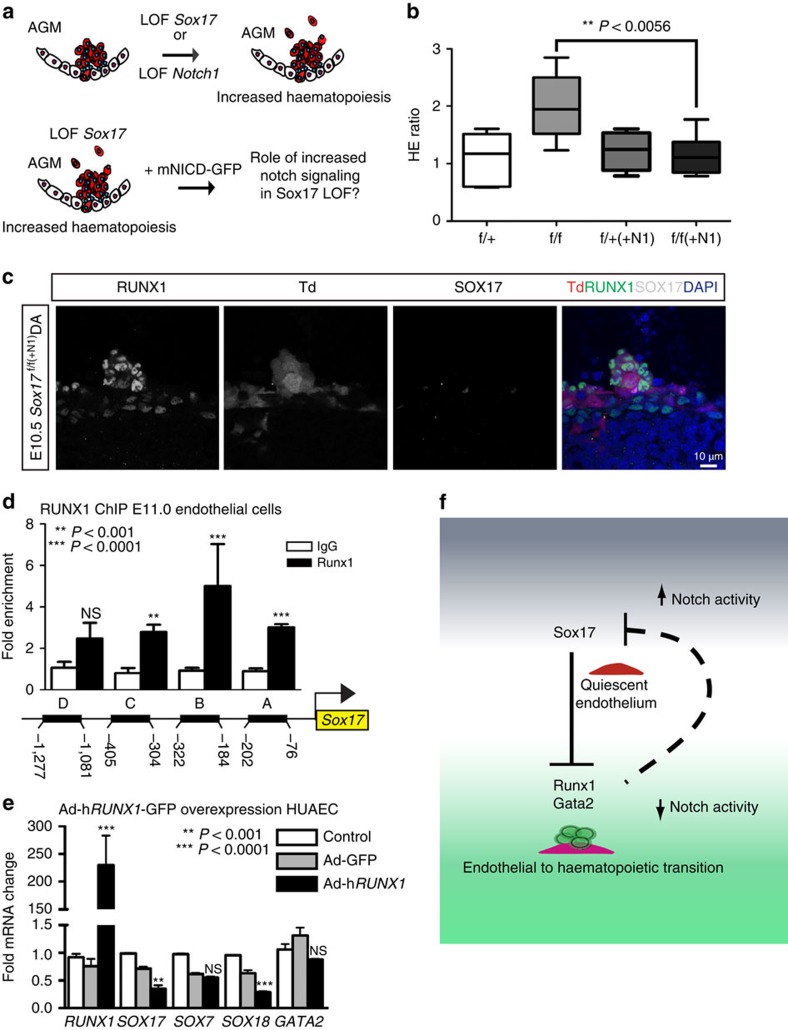
Figure 5. Parsing endothelial and haematopoietic fates during EHT.
(a) Schematic depicting Sox17 or Notch1 loss of function (LOF) and strategy for evaluating Notch overexpression (mNICD-GFP) in Sox17 mutants. NICD, Notch1 intracellular domain. (b) HE ratios of E11 AGM explants in Sox17 mutants with and without Notch overexpression (+N1). Centre lines represent median values, box represents 25th–75th percentiles and bars represent minimum and maximum values. f/+(−N1) n=7, f/+(+N1) n=3, f/f (−N1) n=5, f/f (+N1) n=8, 3 litters. P values calculated on Student's t-test between groups, significance also validated by two-way analysis of variance (Supplementary Table 2) (c) Immunofluorescence of a representative haematopoietic cluster in a E10.5 Sox17f/f(+N1) AGM after in vivo induction of Cre and NICD at E9.5. SOX17 in grey, traced ECs (Td+) in red and RUNX1+ in green. DAPI in blue. Scale bar, 10 μm. (d) RUNX1 chromatin immunoprecipitation (ChIP) PCR of E11.0 sorted endothelial cells. Letters denote evaluated regions containing RUNX1-binding site consensus sequences upstream of the Sox17 promoter. Error bars indicate s.e.m. IgG control set to one for comparisons of fold change, n=3 litters, embryos pooled, P values as indicated. (e) Adenoviral-mediated overexpression of hRUNX1 in HUAECs and qRT–PCR analyses, P values calculated with respect to Adeno-GFP-infected cells, control represents uninfected cells (n=3 experiments, error bars indicate s.e.m.). (f) Schematic depicting the cell fate switch from endothelial to haematopoietic fate, and the governing regulatory pathways of EHT. Sox17 inhibition of Runx1 and Gata2 maintains endothelial fate. Loss of Sox17 inhibition in the context of decreased Notch activity promotes haematopoietic fate conversion.

