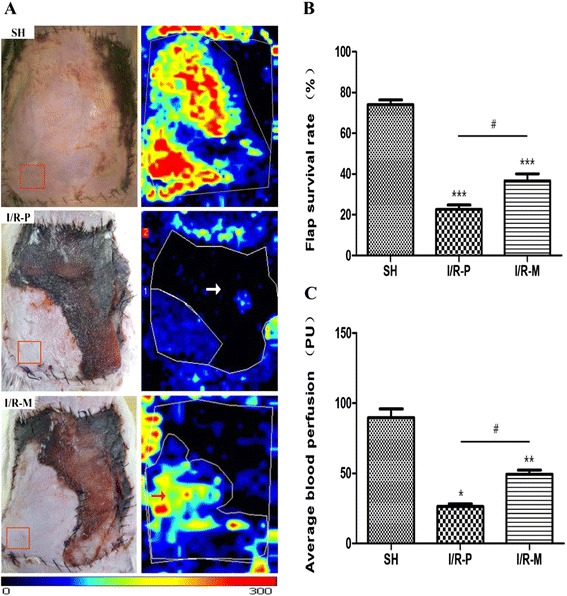
Fig. 1.

The condition of the abdominal skin flaps 72 h after I/R. The red frame represents the sampling position. The white arrow point to black zones represents the lowest blood perfusion. The red arrow point to red, yellow and the adjacent blue areas represent surviving areas with rich blood perfusion. (a) Representative photographs of abdominal skin flap microcirculation in the three groups are shown. (b) The survival rate of the total flap area. Flap survival rates were markedly higher in the I/R-M group. (c) The average blood perfusion of total skin flaps. The average blood perfusion of the total flap was greater in the I/R-M group than in the I/R-P group. The values are the means ± SEM; (n = 6 for each group; *p < 0.05, **p < 0.01, ***p < 0.001 versus the SH group; #p < 0.05 versus I/R-P group)
