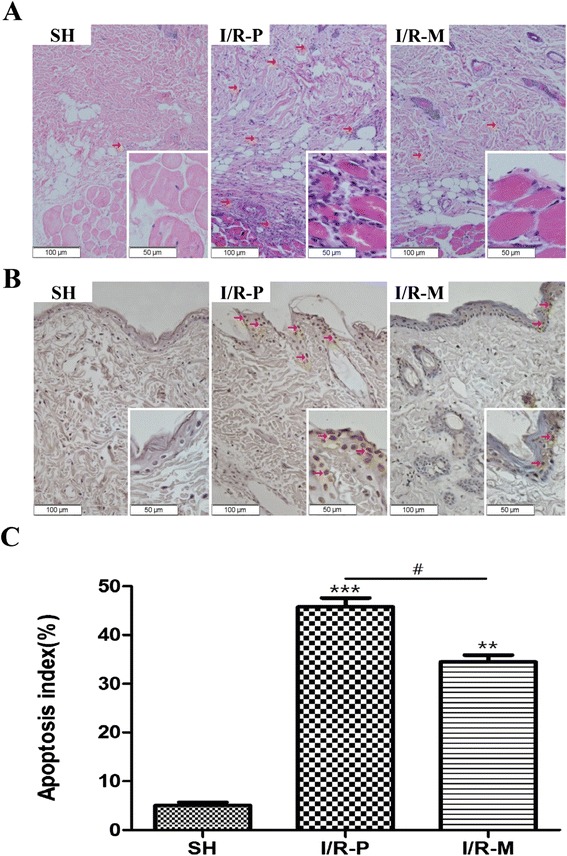
Fig. 2.

The results of H&E and TUNEL staining and the apoptosis index 72 h after I/R. (a) The morphological observation of flap tissue by H&E-staining in all groups. The number of infiltrated cells (red arrow) was much lower in the I/R-M group than in the I/R-P group; (big images: 200×, small image: 400×). (b) The evaluation of apoptotic cell death by TUNEL staining in all groups. Compared to I/R-P, MRS treatment remarkably decreased TUNEL-positive cells in the I/R-M group (brown staining indicates apoptotic cells (red arrow); big images: 200×, small image: 400×). (c) The apoptosis index of all groups. The data are the percentage of TUNEL-positive cells and the total cell nuclei per field, and three different slide fields from different skin tissues were counted. Values are the means ± SEM; (n = 6 for each group; **p < 0.01, ***p < 0.001 versus the SH group; #p < 0.05)
