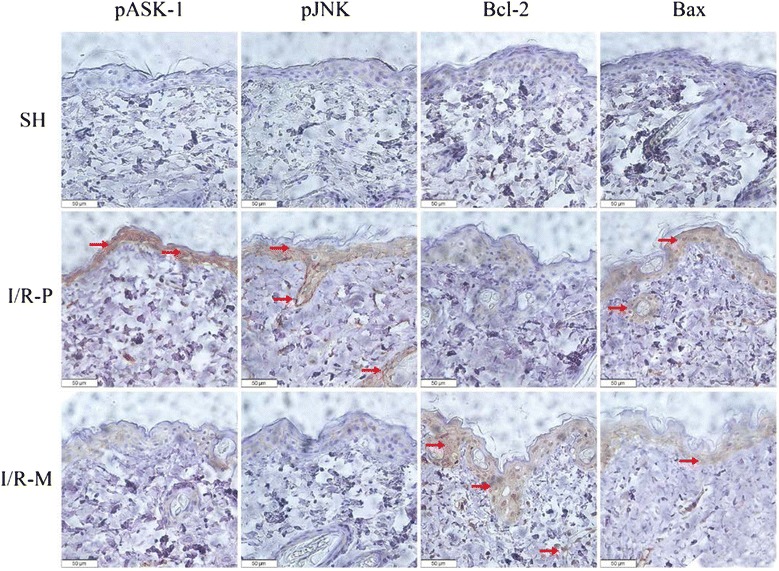
Fig. 3.

An analysis of apoptotic factors 72 h after I/R. Representative micrographs (400×) of flap tissue immunohistochemistry for pASK-1, pJNK, Bcl-2 and Bax in all groups are presented above. Brown staining indicates positive expression areas, and the shade of color represents the expression level of the target protein. The levels of pASK-1, pJNK and Bax were lower in the I/R-M group than in the I/R-P group, with Bcl-2 displaying the opposite pattern
