
Fig. 4.
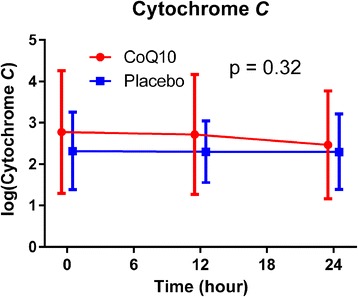
Cytochrome c values over time. Values are reported as log-transformed means with errors bars indicating standard deviations. The P values represent the global tests that values are similar between groups at the 12 and 24 h time points
Official websites use .gov
A
.gov website belongs to an official
government organization in the United States.
Secure .gov websites use HTTPS
A lock (
) or https:// means you've safely
connected to the .gov website. Share sensitive
information only on official, secure websites.
Cytochrome c values over time. Values are reported as log-transformed means with errors bars indicating standard deviations. The P values represent the global tests that values are similar between groups at the 12 and 24 h time points