
Fig. 5.
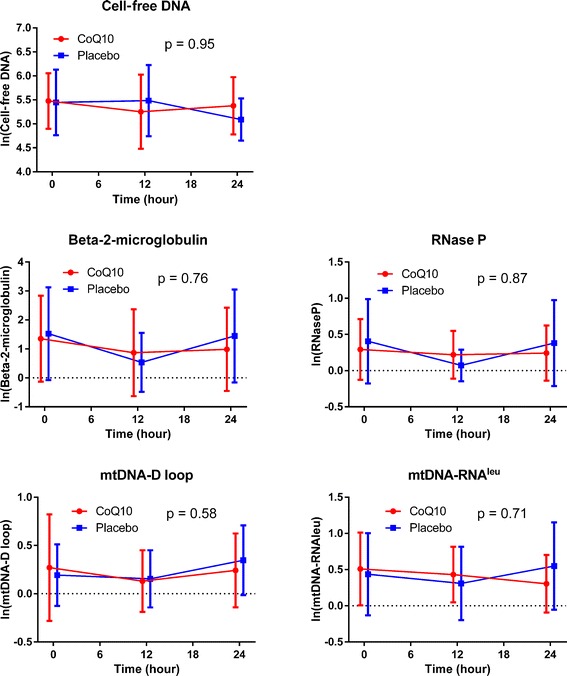
Cell-free DNA, and nucleus and mitochondrial DNA values over time. Values are reported as log-transformed means with errors bars indicating standard deviations. The P values represent the global tests with values that are similar between groups at the 12 and 24 h time points