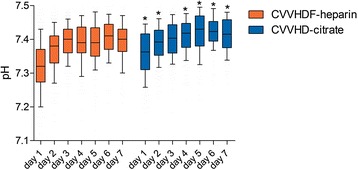
Fig. 2.

Course of pH during CRRT from day 1 to day 7 for all patients. Data are given as box plots, and whiskers represent the 10th/90th percentile. *p < 0.05 vs. heparin. CRRT continuous renal replacement therapy, CVVHDF continuous veno-venous haemodiafiltration, CVVHD continuous veno-venous haemodialysis
