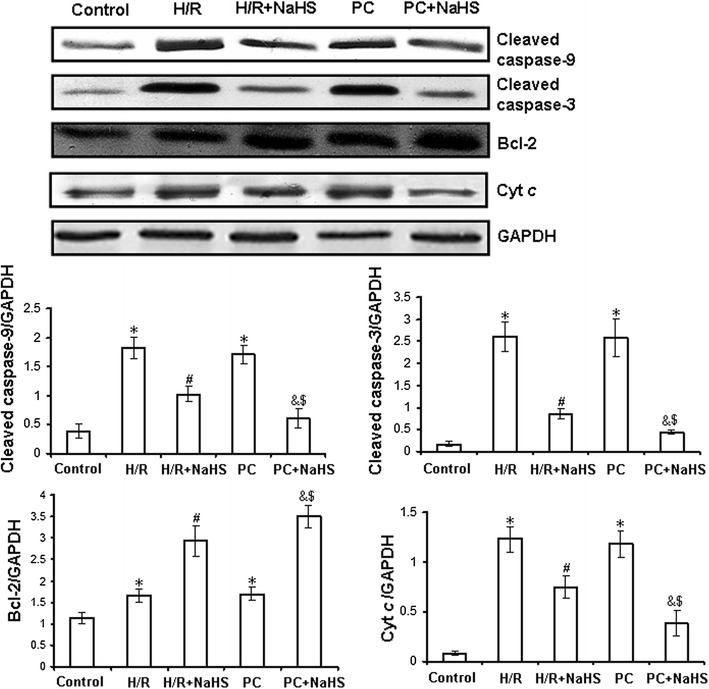
Fig. 5.

Expression of Bcl-2, cleaved caspase-3 and cleaved caspase-9, cytosolic Cyt c in the d-galactose age-induced primary cultured neonatal cardiomyocytes by western blot analysis. The intensity of each band was quantified by densitometry, and data were normalized to the GAPDH signal. All data were from four independent experiments. *p < 0.05 vs. control group; #p < 0.05 vs. H/R group; &p < 0.05 vs. PC group; $p < 0.05 vs. H/R + NaHS group.
